
MUR105
THRU
MUR1100
1 Amp Super Fast
Recovery Rectifier
50 to 1000 Volts
Features
∑
High Surge Capability
∑
Low Forward Voltage Drop
∑
High Current Capability
∑
Super Fast Switching Speed For High Efficiency
Maximum Ratings
∑
Operating Temperature: -50
∞
C to +150
∞
C
∑
Storage Temperature: -50
∞
C to +150
∞
C
MCC
Part Number
Maximum
Recurrent
Peak Reverse
Voltage
Maximum
RMS Voltage
Maximum DC
Blocking
Voltage
MUR105
50V
35V
50V
MUR110
100V
70V
100V
MUR115
150V
105V
150V
MUR120
200V
140V
200V
MUR140
400V
280V
400V
MUR160
600V
420V
600V
MUR180
800V
560V
800V
MUR1100
1000V
700V
1000V
Electrical Characteristics @ 25
∞
C Unless Otherwise Specified
Average Forward
Current
I
F(AV)
1 A
T
A
= 55
∞
C
Peak Forward Surge
Current
I
FSM
35A
8.3ms, half sine
Maximum
Instantaneous
Forward Voltage
MUR105-115
MUR120-160
MUR180-1100
V
F
.975V
1.35V
1.75V
I
FM
= 1.0A;
T
A
= 25
∞
C
Maximum DC
Reverse Current At
Rated DC Blocking
Voltage
I
R
5
µ
A
50
µ
A
T
A
= 25
∞
C
T
A
= 150
∞
C
Maximum Reverse
Recovery Time
MUR105-120
MUR140-160
MUR180-1100
T
rr
45ns
60ns
75ns
I
F
=0.5A, I
R
=1.0A,
I
rr
=0.25A
Typical Junction
Capacitance
C
J
20pF
Measured at
1.0MHz, V
R
=4.0V
*Pulse Test: Pulse Width 300
µ
sec, Duty Cycle 1%
DO-41
DIMENSIONS
INCHES
MM
DIM
MIN
MAX
MIN
MAX
NOTE
A
.166
.205
4.10
5.20
B
.080
.107
2.00
2.70
C
.028
.034
.70
.90
D
1.000
---
25.40
---
A
B
C
D
D
Cathode
Mark
www.
mccsemi
.com
omponents
21201 Itasca Street Chatsworth
!"#
$
% !"#
M C C

Average Forward Rectified Current - Amperes versus
Ambient Temperature -
∞
C
Figure 2
Forward Derating Curve
25
175
50
75
100
125
0
.25
.5
.75
Single Phase, Half Wave
60Hz Resistive or Inductive Load
Amps
∞
C
150
1.0
1.25
1.5
Junction Capacitance - pF versus
Reverse Voltage - Volts
Instantaneous Forward Current - Amperes versus
Instantaneous Forward Voltage - Volts
Figure 1
Typical Forward Characteristics
4
6
20
10
Amps
.5
.7
.9
1.1
1.3
1.5
.01
.02
.04
.06
.1
.2
.4
.6
1
2
25
∞
C
Volts
Figure 3
Junction Capacitance
.1
.2
1
.4
2
10
20
40
4
100
200
1
2
6
10
20
100
pF
Volts
60
40
4
400
1000
T
J
=25
∞
C
MUR105-115
MUR120-160
MUR105 thru MUR1100
MUR180-1100
www.
mccsemi
.com
M C C
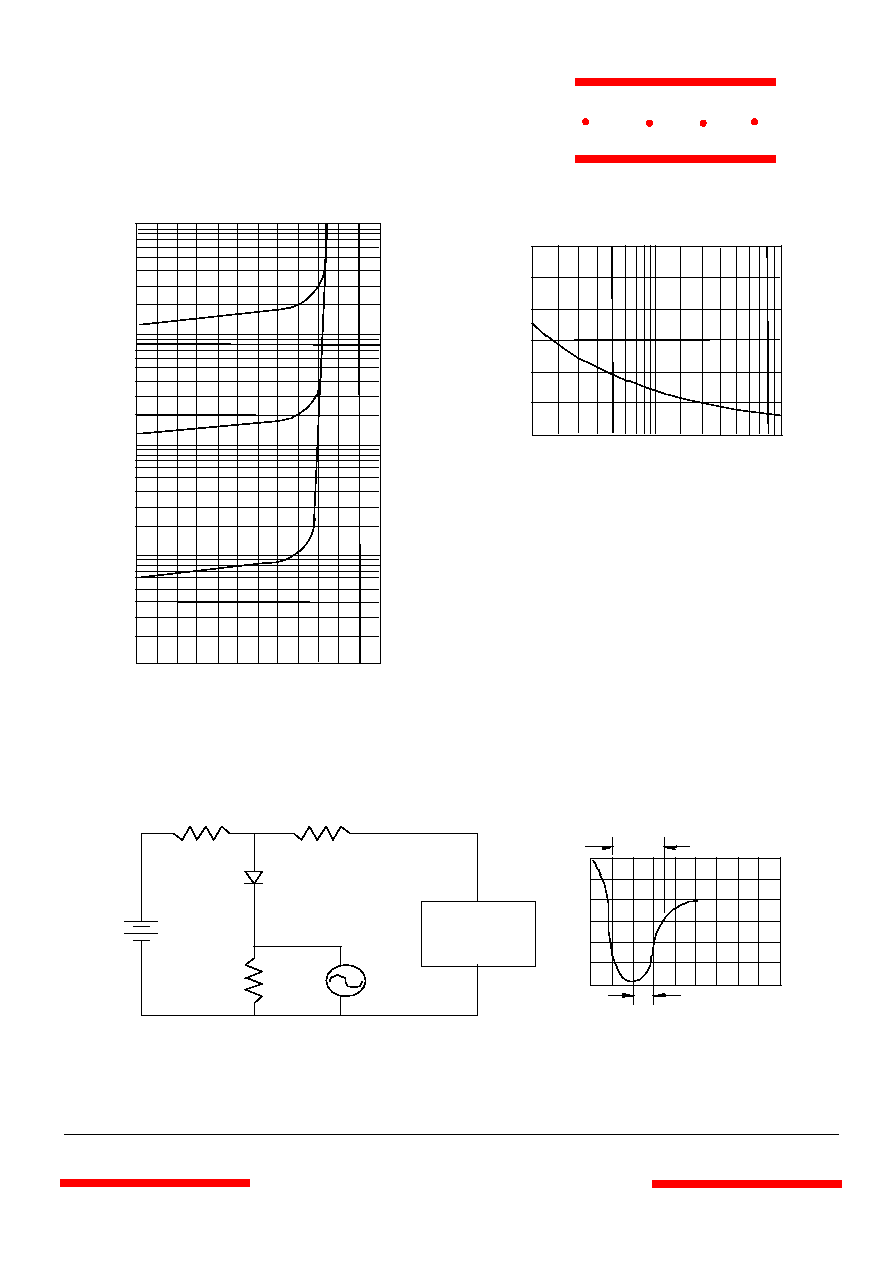
t
rr
+0.5A
0
-0.25
-1.0
1cm
Set Time Base for 20/100ns/cm
25Vdc
1
50
10
Oscilloscope
Note 1
Pulse
Generator
Note 2
Notes:
1. Rise Time = 7ns max.
Input impedance = 1 megohm, 22pF
2. Rise Time = 10ns max.
Source impedance = 50 ohms
3. Resistors are non-inductive
Figure 6
Reverse Recovery Time Characteristic And Test Circuit Diagram
1
100
4
0
10
20
30
8
Figure 5
Peak Forward Surge Current
Peak Forward Surge Current - Amperes versus
Number Of Cycles At 60Hz - Cycles
Amps
Cycles
2
6
10
20
60
80
40
40
50
60
Figure 4
Typical Reverse Characteristics
Instantaneous Reverse Leakage Current - MicroAmperes
versus
Percent Of Rated Peak Reverse Voltage - Volts
Volts
4
6
20
10
µ
Amps
20
120
40
60
80
100
.01
.02
.04
.06
.1
.2
.4
.6
1
2
T
A
=25
∞
C
40
60
100
140
T
A
=100
∞
C
T
A
=150
∞
C
MUR105 thru MUR110
www.
mccsemi
.com
M C C