 | –≠–Ľ–Ķ–ļ—ā—Ä–ĺ–Ĺ–Ĺ—č–Ļ –ļ–ĺ–ľ–Ņ–ĺ–Ĺ–Ķ–Ĺ—ā: GL514 | –°–ļ–į—á–į—ā—Ć:  PDF PDF  ZIP ZIP |

*1 Pulse width<= 200
Ķ
s
Duty ratio = 0.01
*2 For 10 seconds at the position of 1.3mm from the bottom
Emitting Diode
s
Features
s
Applications
GL514/GL513F
4. High reliability, long operation life
1. Optoelectronic switches
2. Smoke detectors
3. Infrared applied systems
I
F
= 100mA
I
F
= 100mA
GL514/GL513F
Parameter
Symbol
Conditions
MIN.
TYP.
MAX.
Unit
Forward voltage
V
F
I
F
= 100mA
-
1.35
1.6
V
Peak forward voltage
V
FM
I
FM
= 1.5A
-
2.75
4.0
V
Reverse current
I
R
V
R
= 5V
-
-
100
Terminal capacitance
C
t
V = 0, f = 1MHz
-
70
-
pF
GL514
e
I
F
= 100mA
3.31
5.35
10.0
mW
1.44
2.88
-
mW
GL513F
Peak emission wavelength
p
I
F
= 100mA
-
950
-
nm
Half intensity wavelength
I
F
= 100mA
-
45
-
nm
*3
Radiant flux
1.0
1.0
45
į
2.5
GL514
Glass lens
GL514
13
4.5
2.5
1.0
45
į
1.0
13
GL513F
GL513F
Glass window
1. Output :
GL514
e
MIN. 3.31mW at
GL513F
e
MIN. 1.44mW at
s
Outline Dimensions
(Unit : mm )
Symbol
Rating
Unit
P
250
mW
Forward current
I
F
150
mA
*1
Peak forward current
I
FM
2
A
Reverse voltage
V
R
6
V
Operating temperature
T
opr
- 40 to + 125
įC
Storage temperature
T
stg
- 55 to + 125
įC
*2
Soldering temperature
T
sol
260
įC
s
Absolute Maximum Ratings
(Ta = 25įC )
s
Electro-optical Characteristics
(Ta = 25įC )
GL513F
:
TYP. Ī 50į
2. Beam angle :
GL514
:
TYP. Ī 7į
1
Cathode
2
Anode
1
2
1
2
1
2
Ķ
A
Parameter
Power dissipation
3. To- 18 type standard package
face of can package.
data books, etc. Contact SHARP in order to obtain the latest version of the device specification sheets before using any SHARP's device.
"
"
In the absence of confirmation by device specification sheets, SHARP takes no responsibility for any defects that occur in equipment using any of SHARP's devices, shown in catalogs,
TO-18 Type Infrared
3
0.45
0.45
4.7
Ī
0.1
4.7
Ī
0.1
3.7
MAX.
6.6
MAX.
5.7
MAX.
5.7
MAX.
GL514/GL513F
200
175
150
125
100
75
50
25
0
Relative radiant intensity
(
%
)
900
925
975
Wavelength
( nm )
900
920
940
880
0
20
40
80
100
10
20
50
100
200
500
Duty ratio
2
5
60
950
0
125
25
50
75
- 25
0
100
25
50
75
- 25
960
980
100
2
5
2
5
Pulse width <=200
Ķ
s
Forward current I
F
(
mA
)
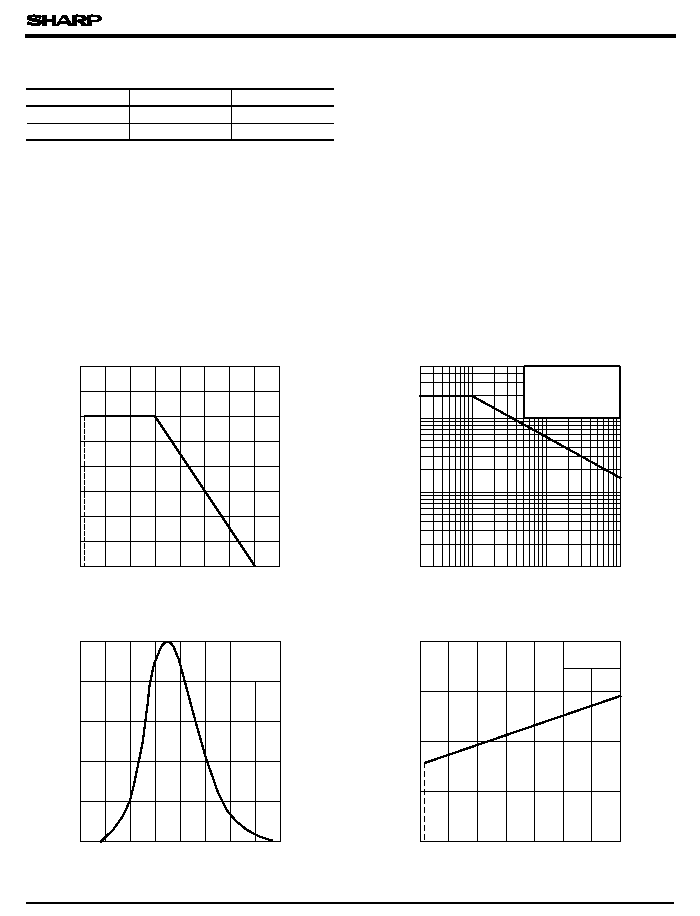
Fig. 1 Forward Current vs.
Ambient Temperature
10
- 2
10
- 1
Fig. 3 Spectral Distribution
Peak emission wavelength
P
(
nm
)
Fig. 4 Peak Emission Wavelength vs.
Ambient Temperature
Fig. 2 Peak Forward Current vs. Duty Ratio
*
3 Classification Table of Radiant Flux
Model No.
Rank Mark
GL514A
A
5.35 to 10.0
GL514
-
3.31 to 10.0
at I
F
= 100mA, Ta = 25įC
I
F
= 40mA
T
a
= 25įC
- 50
125
150
Peak forward current I
FM
(
mA
)
- 50
Ambient temperature T
a
( įC )
T
a
= 25įC
1
I
F
= const.
Ambient temperature T
a
( įC )
e
( mW )
2000
1000
1000
1000
1020
1040
- 40
- 40

GL514/GL513F
0
500
200
100
50
20
10
5
2
1
Relative radiant intensity
(
%
)
0.1
100
10
1
0.1
Distance to detector d ( mm )
0.1
0.2
0.5
2
5
10
20
50
100
0.1
0.2
0.5
1
2
5
10
20
- 25
75
50
25
100
0
1
DC
25įC
0įC
75įC
50įC
125
Relative radiant intensity
(
%
)
DC
1
100
50
20
10
5
2
0.5
0.2
0.1
1
50
20
5
2
0.5
0.2
0.2
0.5
1
2
5
10
20
50 100
100
50
20
10
5
2
1
0.5
0.2
Distance to detector d ( mm )
0.1
100
50
20
10
5
2
1
0.5
0.2
0.1
Fig. 5 Forward Current vs. Forward Voltage
Fig. 6 Relative Radiant Flux vs.
Ambient Temperature
Forward current I
F
(
mA
)
Relative radiant flux
- 25įC
Fig. 7 Radiant Flux vs.
Fig. 8 Radiant Flux vs.
Fig. 9 Relative Radiant Intensity vs.
Fig.10 Relative Radiant Intensity vs.
Forward Current
(GL514 )
Forward Current
(GL513F)
Distance
(GL514 )
Distance
(GL513F)
1
2
3
Pulse
( Pulse width
<=200
Ķ
s)
Pulse
( Pulse width
<= 200
Ķ
s)
Radiant flux
e
(
mW
)
Forward current I
F
( mA )
Radiant flux
e
(
mW
)
Forward current I
F
( mA )
T
a
= 100įC
Ambient temperature T
a
( įC )
T
a
= 25įC
T
a
= 25įC
T
a
= 25įC
T
a
= 25įC
I
F
= const.
2
5
2
5
10
2
2
5
10
3
10
4
10
2
5
2
5
10
2
2
5
10
3
10
4
Forward voltage V
F
( V)

GL514/GL513F
80
60
40
20
100
0
Angular displacement
80
60
40
20
100
0
Augular displacement
0
+ 90į
+ 80į
+ 70į
+ 50į
+ 60į
+ 40į
+ 30į
- 30į
- 40į
- 50į
- 60į
- 70į
- 80į
- 90į
0
+ 90į
+ 80į
+ 70į
+ 50į
+ 60į
+ 40į
+ 30į
- 30į
- 40į
- 50į
- 60į
- 70į
- 80į
- 90į
- 20į
- 10į
+ 10į
+ 20į
Relative radiant intensity
(
%
)
- 20į
- 10į
+ 10į
+ 20į
Relative radiant intensity
(
%
)
Fig.11 Radiation Diagram
(GL514 )
Fig.12 Radiation Diagram
(GL513F)
(T
a
= 25įC)
(T
a
= 25įC)
q Please refer to the chapter " Precautions for Use."